
German economy resilient despite prolonged shutdown: further recovery expected in the summer
ECONOMIC OUTLOOK FOR 2021 AND 2022
Click to share
(SUM) The performance of the global economy during the second year of the coronavirus pandemic varies considerably between sectors and regions. Industry is increasingly recovering from its slump in the spring of 2020 due to rising demand for goods, while the situation in consumer-related services in particular remains tense. Overall economic activity, particularly in China and other Asian countries as well as the United States, continues on an upward trajectory. The recovery in Europe, on the other hand, is pausing. However, the higher infection rates and stricter containment measures are inflicting much less damage on the economy than during the first wave of infections in spring 2020. One reason for this is the positive trend both, in industry and in goods trade. So far there has been no massive disruption of international supply chains or widespread border closures. It is also likely that households and firms have adapted better to the pandemic-related restrictions.
Although economic output in Germany was still growing marginally at the end of 2020 a decline is expected for the first quarter of 2021. The economic recovery is likely to resume over the coming months as the pandemic is increasingly contained and restrictions are gradually eased. This recovery will be assisted by the growing availability of vaccines. If plans to accelerate the vaccination programme are successful, this should allow for more economic activity. The value added that cannot take place particularly in the services sector at present should then return gradually and generate strong growth throughout the remainder of 2021.
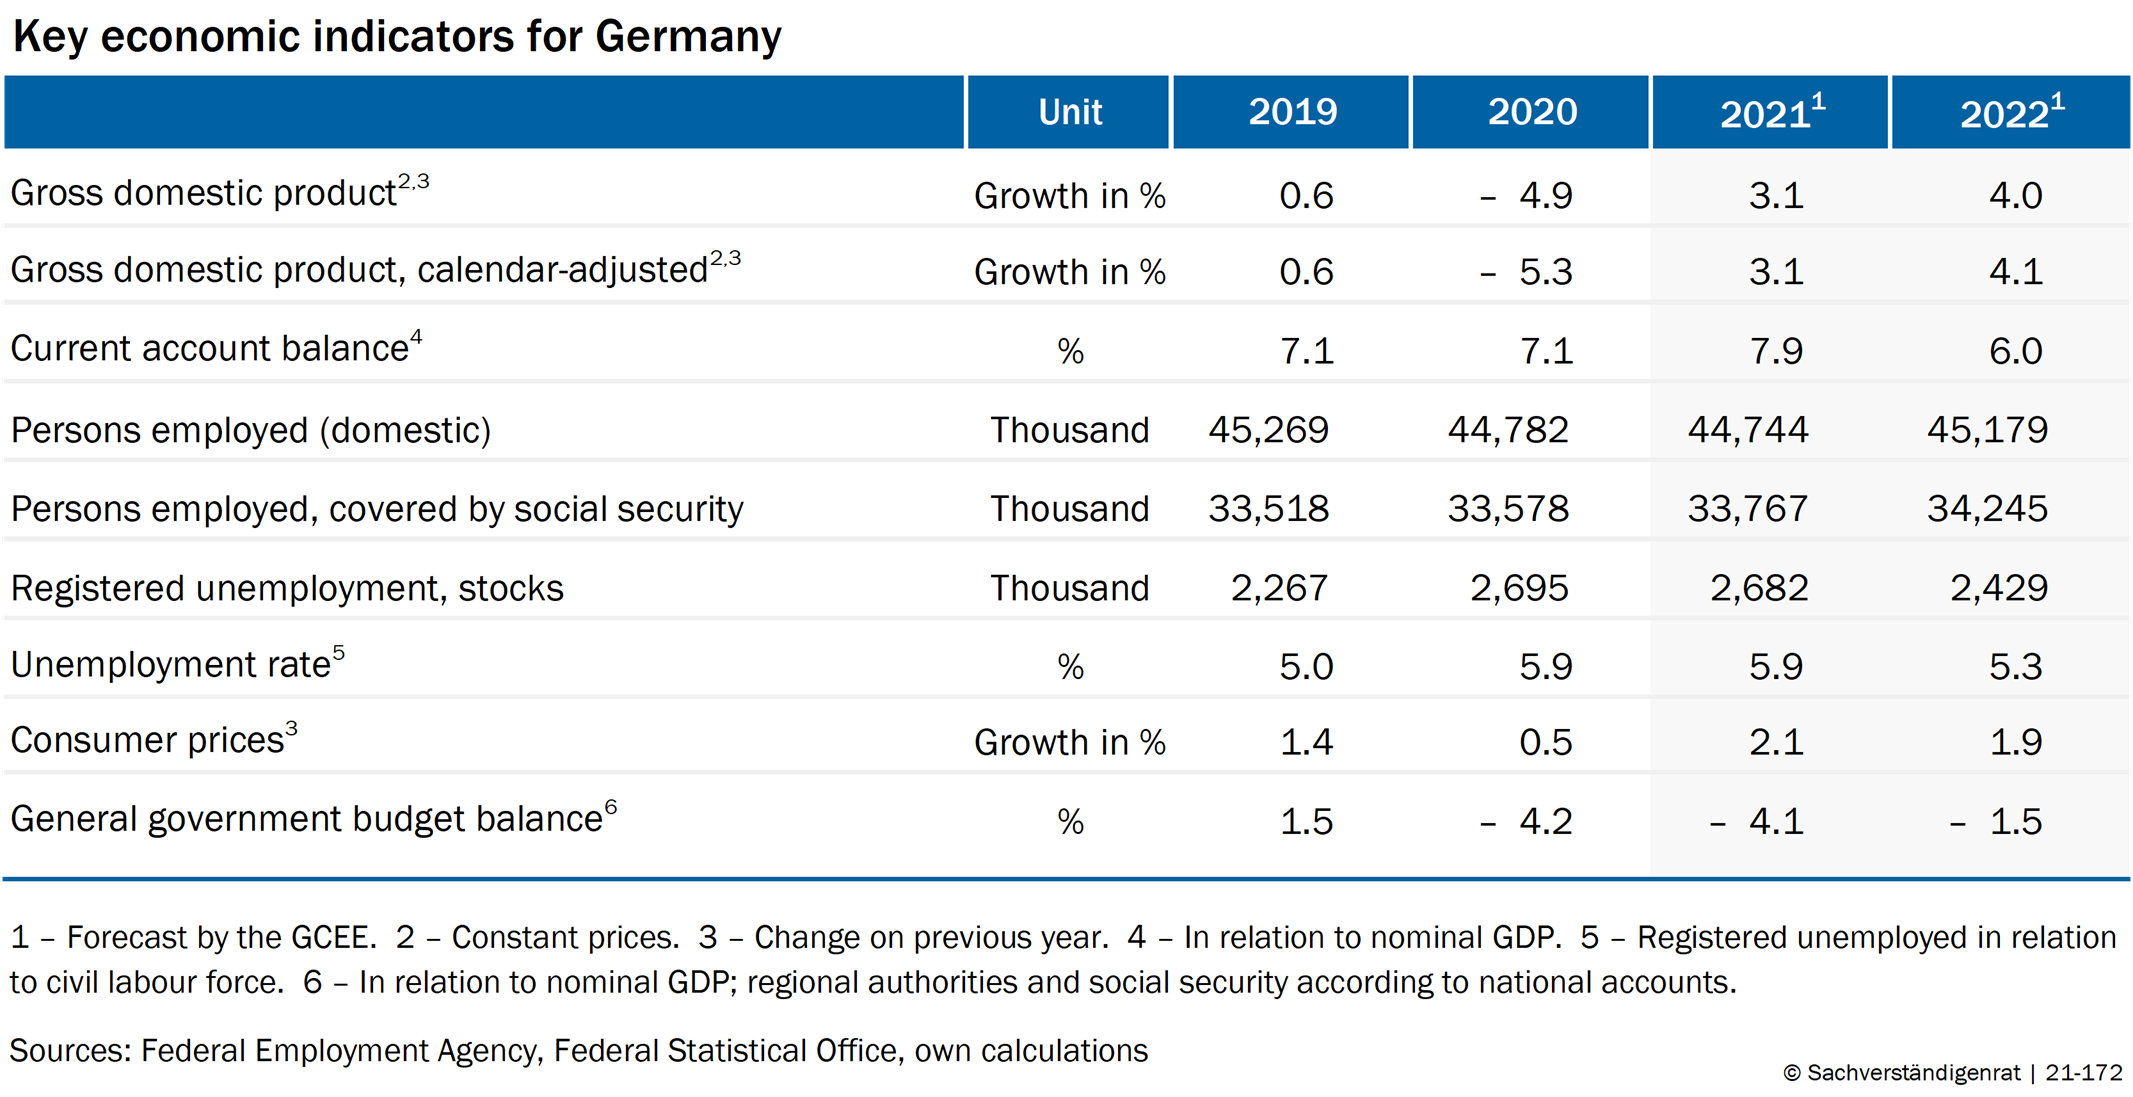
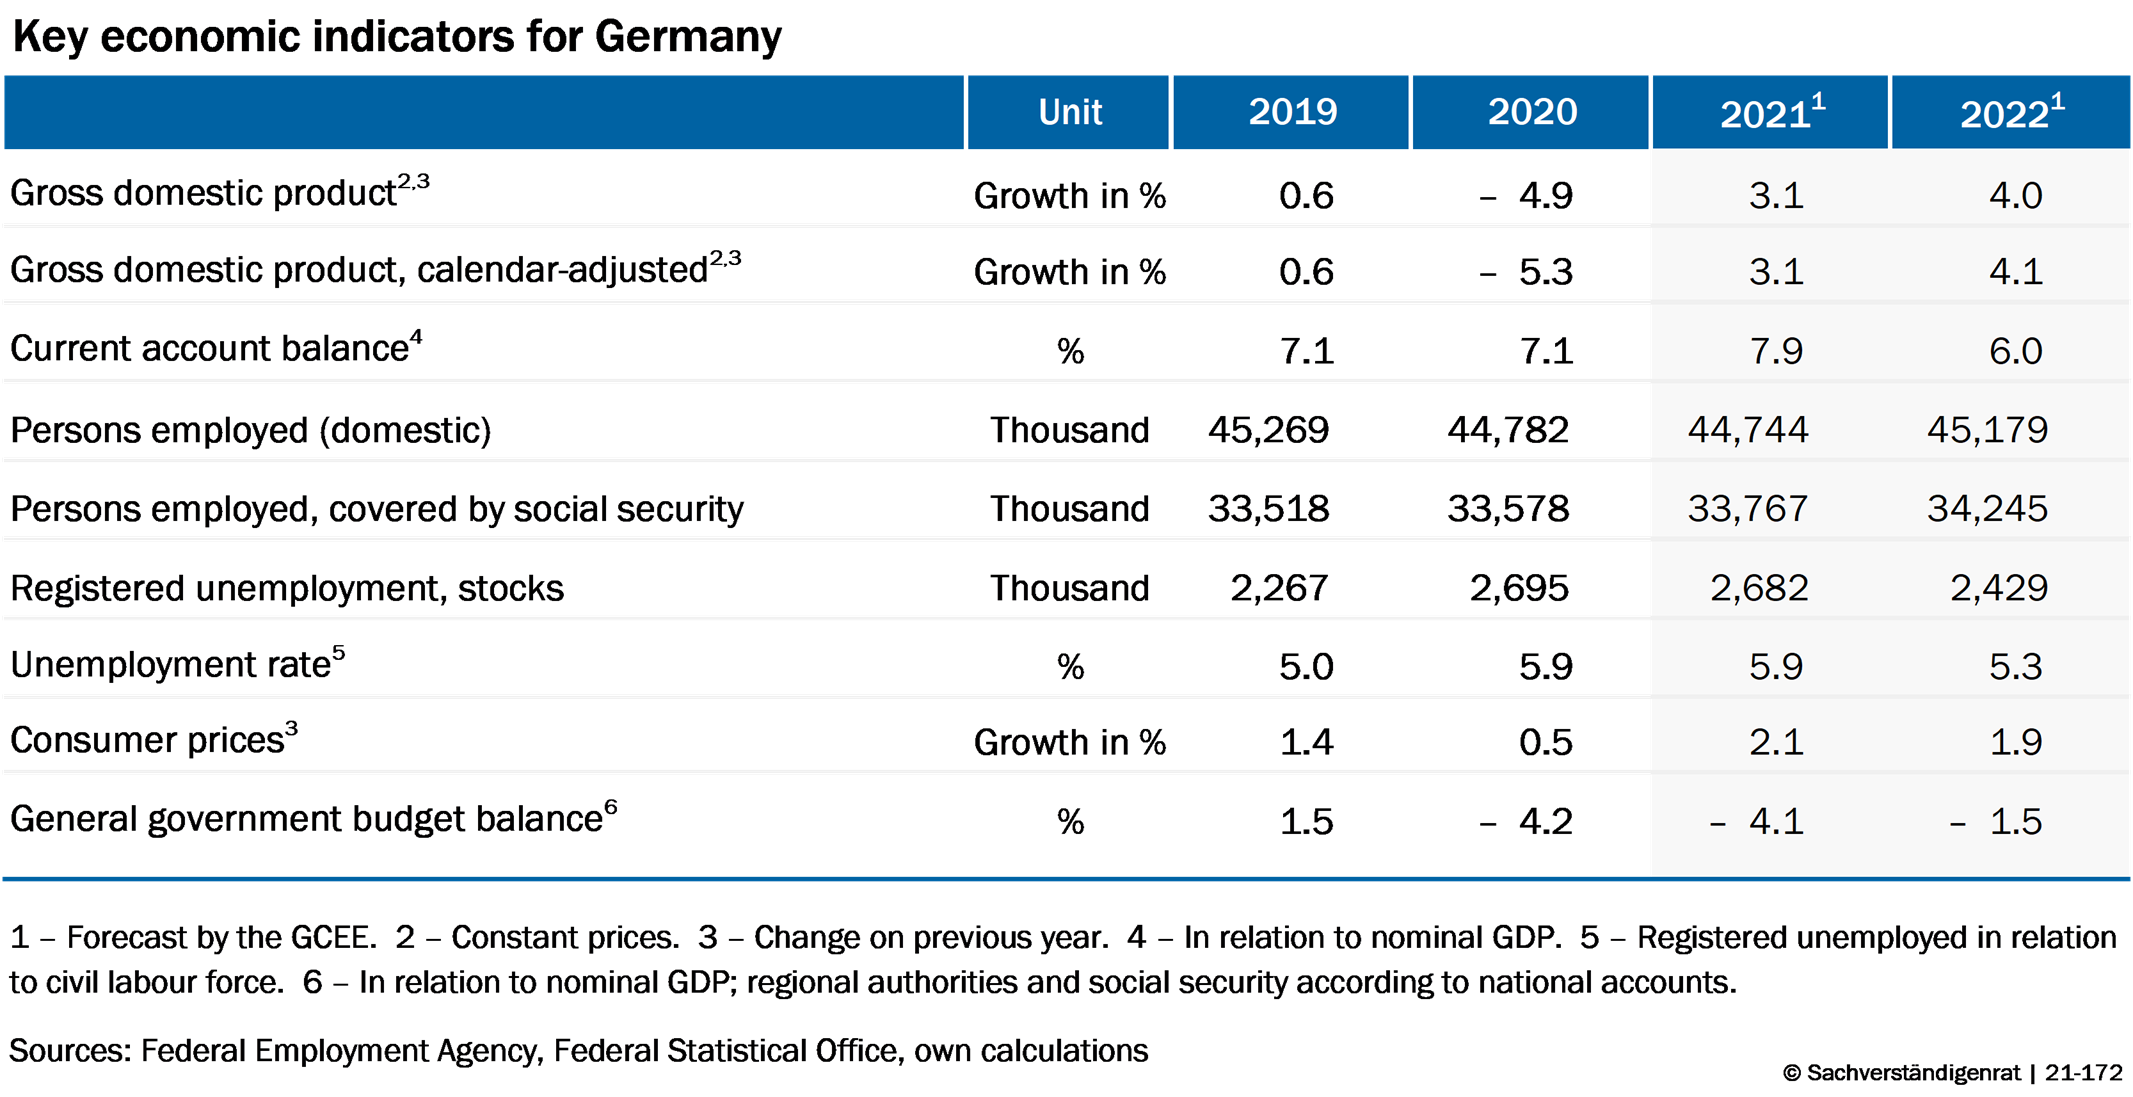
The German Council of Economic Experts (GCEE) expects gross domestic product (GDP) in Germany to grow by 3.1 % this year. The economic recovery is set to continue apace next year as demand rises worldwide and consumers run down the savings that they have accumulated. The GCEE expects GDP to grow by 4.0 % in 2022. Consumer price inflation is likely to rise temporarily this year especially as a result of higher energy prices and the expiry of the VAT cut. The GCEE is forecasting that the rate of inflation in Germany will average 2.1 % and 1.9 % in 2021 and 2022, respectively. It expects GDP in the euro area to grow by 4.1 % and 4.2 % in 2021 and 2022, respectively.
Germany and Europe are currently exposed to the risk of a third wave of infections, which is being exacerbated by the spread of mutations of the SARS-CoV-2 virus. A sharp rise in infection rates could delay economic recovery, especially if industry was severely affected by restrictions and plant closures. In contrast, swifter progress on vaccinations could contain the pandemic sooner, allow restrictions to be lifted and accelerate recovery.

Your browser is outdated
Please update your Browser to view this website properly.
You will need at least Internet Explorer 11 to see our interactive charts.
Mozilla Firefox or alternatively Google Chrome will provide the best experience for this website. Update your browser now